

Did you know that the Pantone color of the year is 18-3838? More specifically, Ultra Violet? My guess is not because you are probably more of a numbers person than a colors person.
That being said….just because your comfort zone is trends, measures, and dashboards does not mean you have to forgo the beautification of your reports. As of the August 2018 desktop update, themes are generally available. Let’s take a look at this feature set.
To find the Themes menu, go to the Home tab in the PBI Desktop.
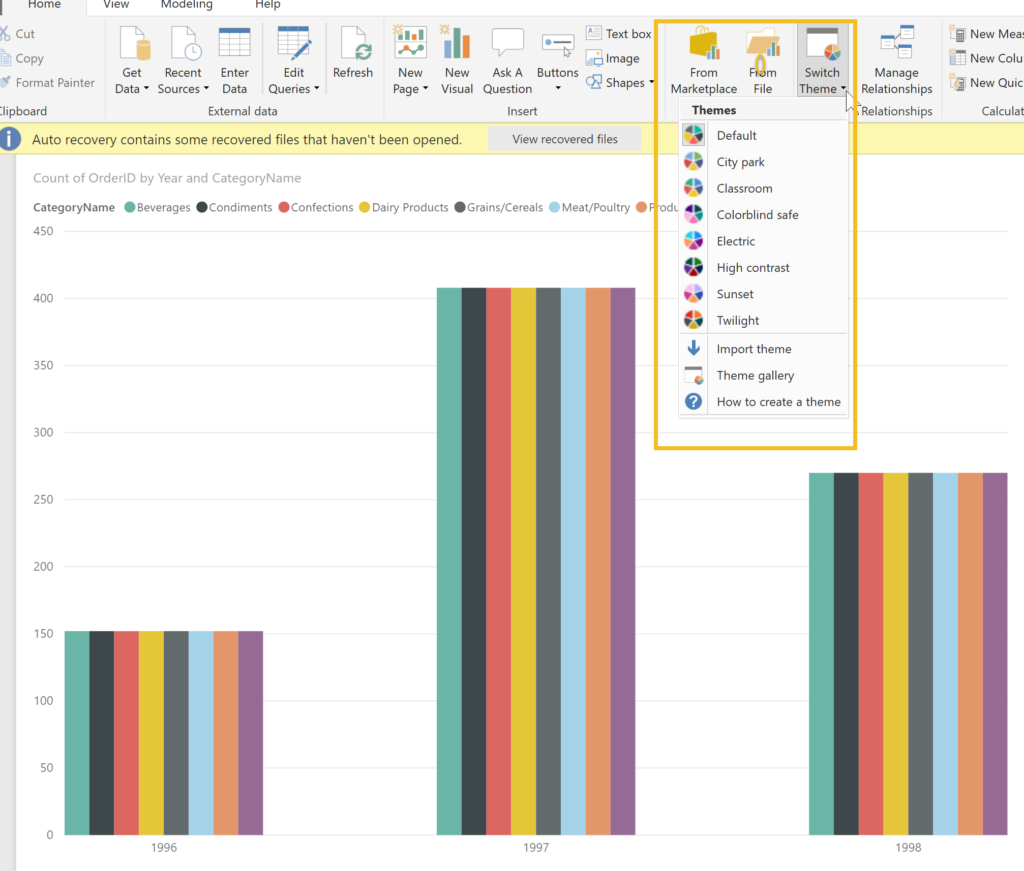
Have fun for a few minutes changing the theme from the default (which we are all used to by now) to others.
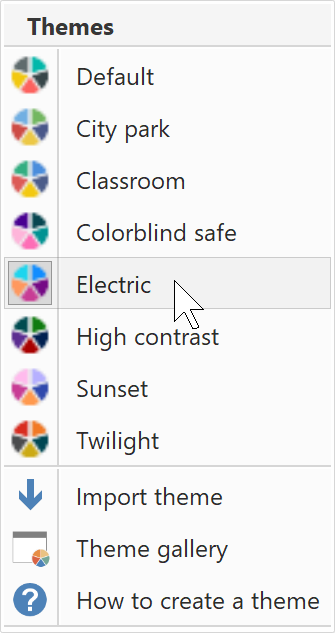
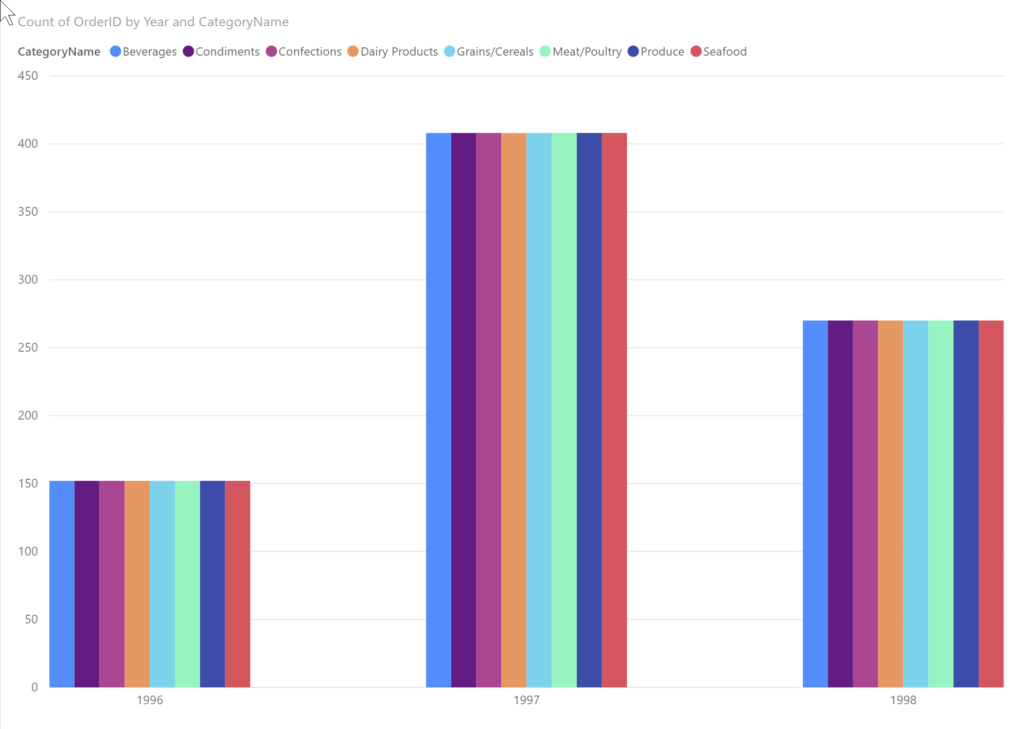
My personal favorite is Electric, but you certainly could choose a theme for more serious (and considerate reasons) such as the Color Blind Safe or High Contrast for those with low vision.
(Accessibility is a huge and growing issue on the Internet, and it behooves all of us to be considerate of those for whom sight is not as easy.)
This is all very nice, and will certainly make a refreshing change from the standard Default theme. But what about that Pantone color? Or your company’s logo colors? How can you incorporate those colors into your reports in Power BI?
If you are lucky, someone in your company has developed a theme that you can import into your PBI file. How would you do that? First, get a copy of the file, just like you would any other file. Store it someplace electronically you can access (such as OneDrive or Teams), then use the Import Theme command to bring it in.
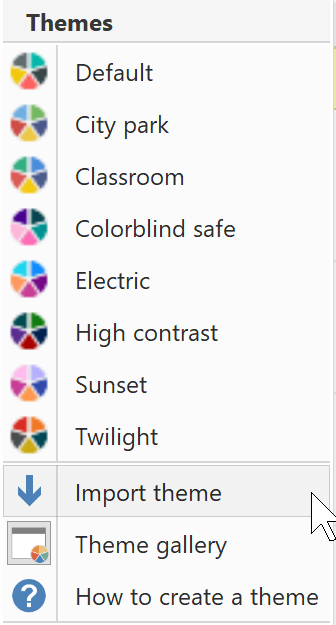
This step will open up the File Explorer window, and you can go looking for the theme file, which will have a suffix of .json.
(What is Json? It’s a programming language, but don’t ask me more than that–it’s above my pay grade. There are lots of sites that can explain it better than I can.)
All well and good, but most of us are not so lucky as to have in-house developers or far sighted corporate identity offices who will make sure we can readily access a customized theme. So what do we do?
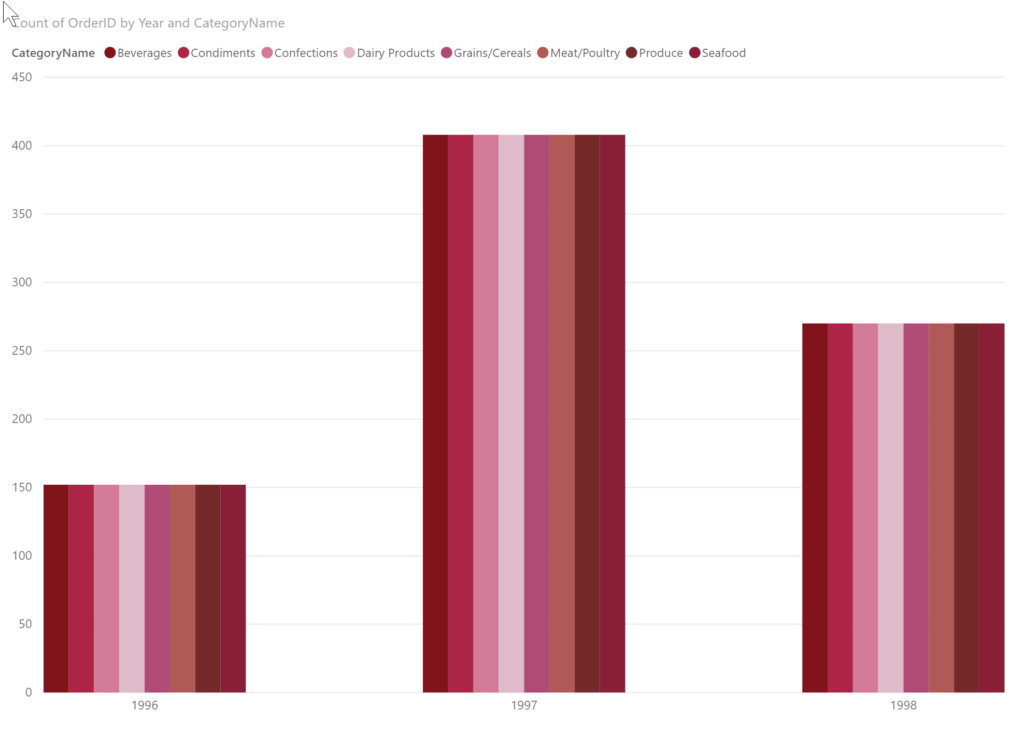
Good news–the Power BI team has got our backs! In their documentation, they have posted lengthy instructions on how to use Custom Report themes. The best part? They have provided .json samples we can edit and put in custom colors. Here’s a Valentine’s Day sample taken directly from their site:
{
“name”: “Valentine’s Day”,
“dataColors”: [“#990011”, “#cc1144”, “#ee7799”, “#eebbcc”, “#cc4477”, “#cc5555”, “#882222”, “#A30E33”],
“background”:”#FFFFFF”,
“foreground”: “#ee7799”,
“tableAccent”: “#990011”
}
The colors are hexadecimal notation, which is just a fancy word for a color code. Copy this text straight from here into a notepad application. Then save it as Filename.json in the Filename field. Don’t worry that the extension is .txt. Next, go to Power BI Desktop, Import Theme, navigate to this file, and import it. Boom! Some things are so easy they ought to be illegal!
Now we are having fun with color. How do we find the numbers for the colors we want to use? Where, for example, do I find the hexadecimal conversion for Pantone 18-3838? First, a brief explanation of color names.
There are four main color naming/numbering conventions used: Pantone, RGB, CMYK and hexadecimal. Any Pantone color can be ‘translated’ into an RGB, CMYK or hexadecimal number (or vice versa).
(RGB stands for Red, Green, Blue, and is the standard used when displaying colors on monitors. CMYK stands for Cyan, Magenta, Yellow, and Black and is the standard used when printing in four colors. Hexadecimal is a numerical system that is used when assigning colors for a website or something designed to be read on a screen.)
There are many sites you can use to get the conversion. Here’s the one I just went to: Top 12 Pantone Colors for Spring 2018. (This does not represent an endorsement of this site. Feel free to find your own.)
The HEX number for Ultra Violet is 18-3838 is 645394. And there is a whole palette of ‘suggested’ colors to go with it, something I need because I have the color sense of the flopsy bunnies–no disrespect to the bunnies! (True story: my mother once asked me if I even see color!) Now I am going to update the .json file to reflect all these beautiful colors. (And when I say update, all I mean is copy and paste the new HEX numbers.)
Here’s the modified .json file:
{
“name”: “Pantone Spring 2018”,
“dataColors”: [“#ec9787”, “#dbb2d1”, “#00a68c”, “#6c4f3d”, “#ebe1df”, “#bc6ca7”, “#bfd833”, “#dbb2d1”],
“background”:”#c0ab8c”,
“foreground”: “#645394”,
“tableAccent”: “#2e4a62”
}
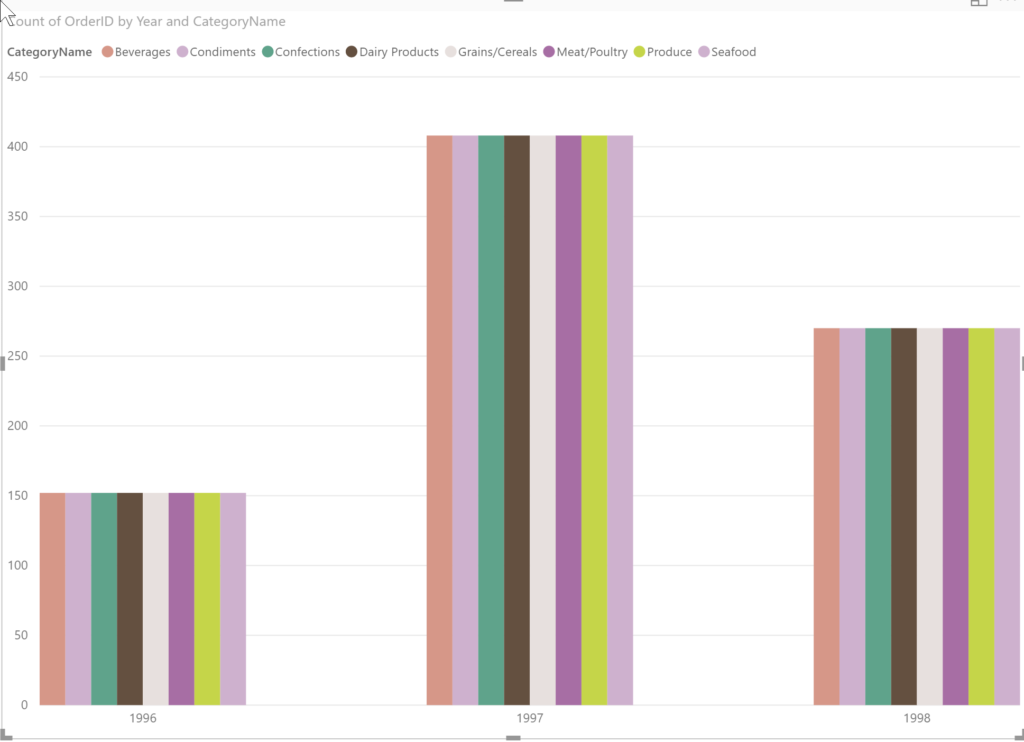
And here’s what the visual looks like with the spring palette:
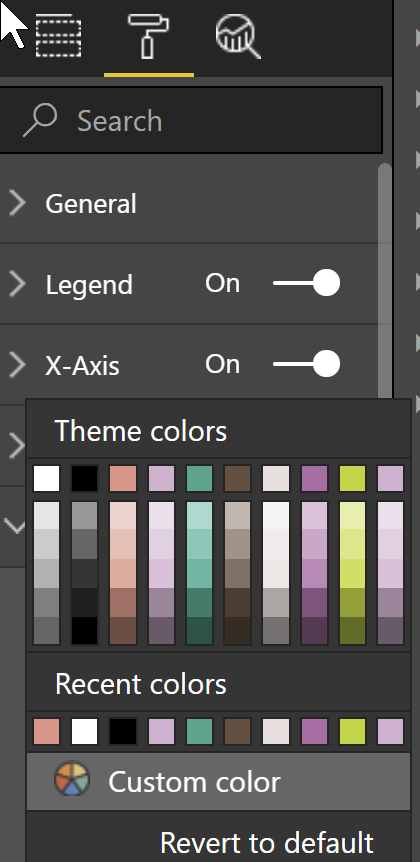
If you go to the Paint Roller tool for this visual, and expand the Data Colors menu, you will see the full palette.
I deliberately kept my .json file very simple, focusing only on adding the HEX numbers, but you can create very elaborate .json files with specific colors for all of the elements. Check out the Microsoft blog post to get started:
It would be painstaking work to create a custom theme for your organization but once done, you could share it widely throughout your organization, and maybe get taken out to lunch by your fellow BI-ers!
So go ahead and break out your inner artist. After all, according to Pantone “we are living in a time that requires inventiveness and imagination”.